Wednesday, February 26, 2014

Science Jam 2014

Yesterday afternoon, 950 grades 4-7 students filled Aberdeen Centre in a celebration of science as the district held our 11th annual Science Jam.

The original goals of Science Jam were to make hands-on, minds-on science accessible to all intermediate students in our district and to promote an enjoyment of science.

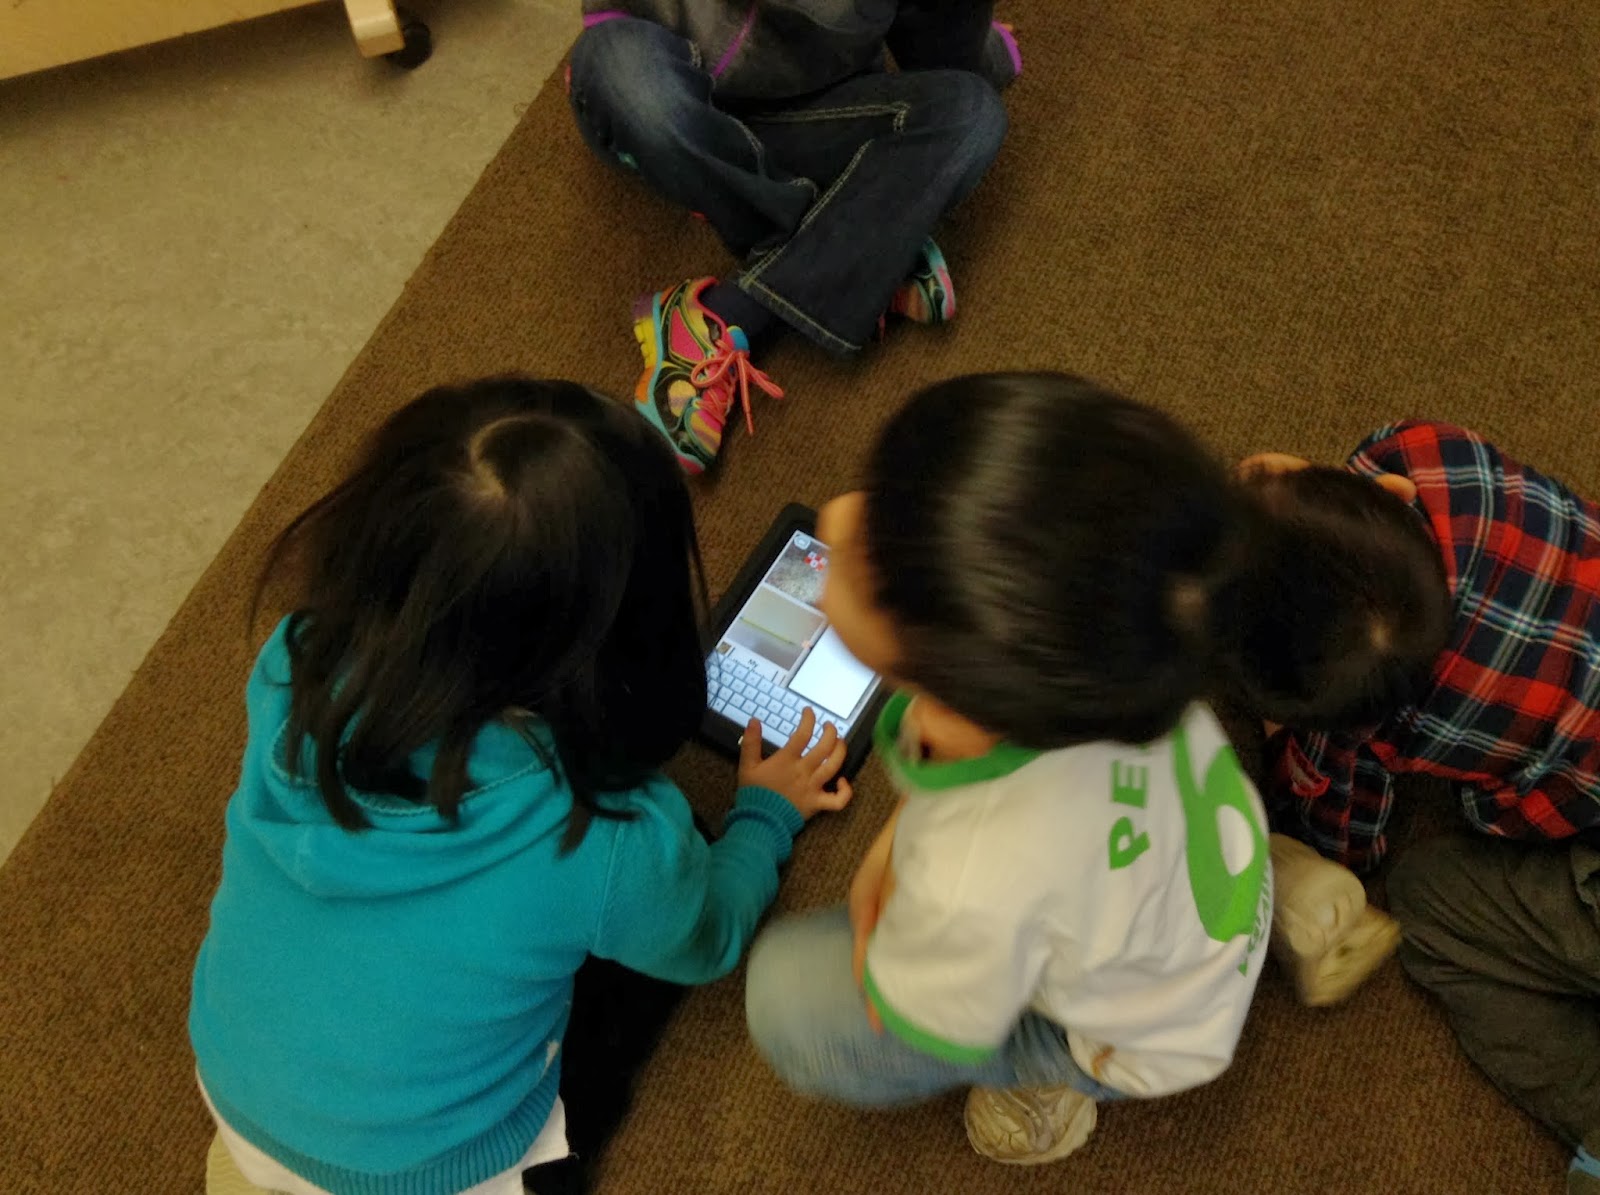
This year 13 elementary schools participated, sharing 450 inquiry-based science projects. The students filled tables with their display boards and wore their Science Jam t-shirts, autographing each others' shirts as they visited displays from different schools.

Five student MCs from Garden City and McNeely Elementary schools did an amazing job opening and closing the event.
Mayor Malcom Brodie welcomed the community to the event and Richmond School Board Chairperson Donna Sergeant and Assistant Superintendent Lynn Archer also shared a few words of encouragement to our elementary scientists.

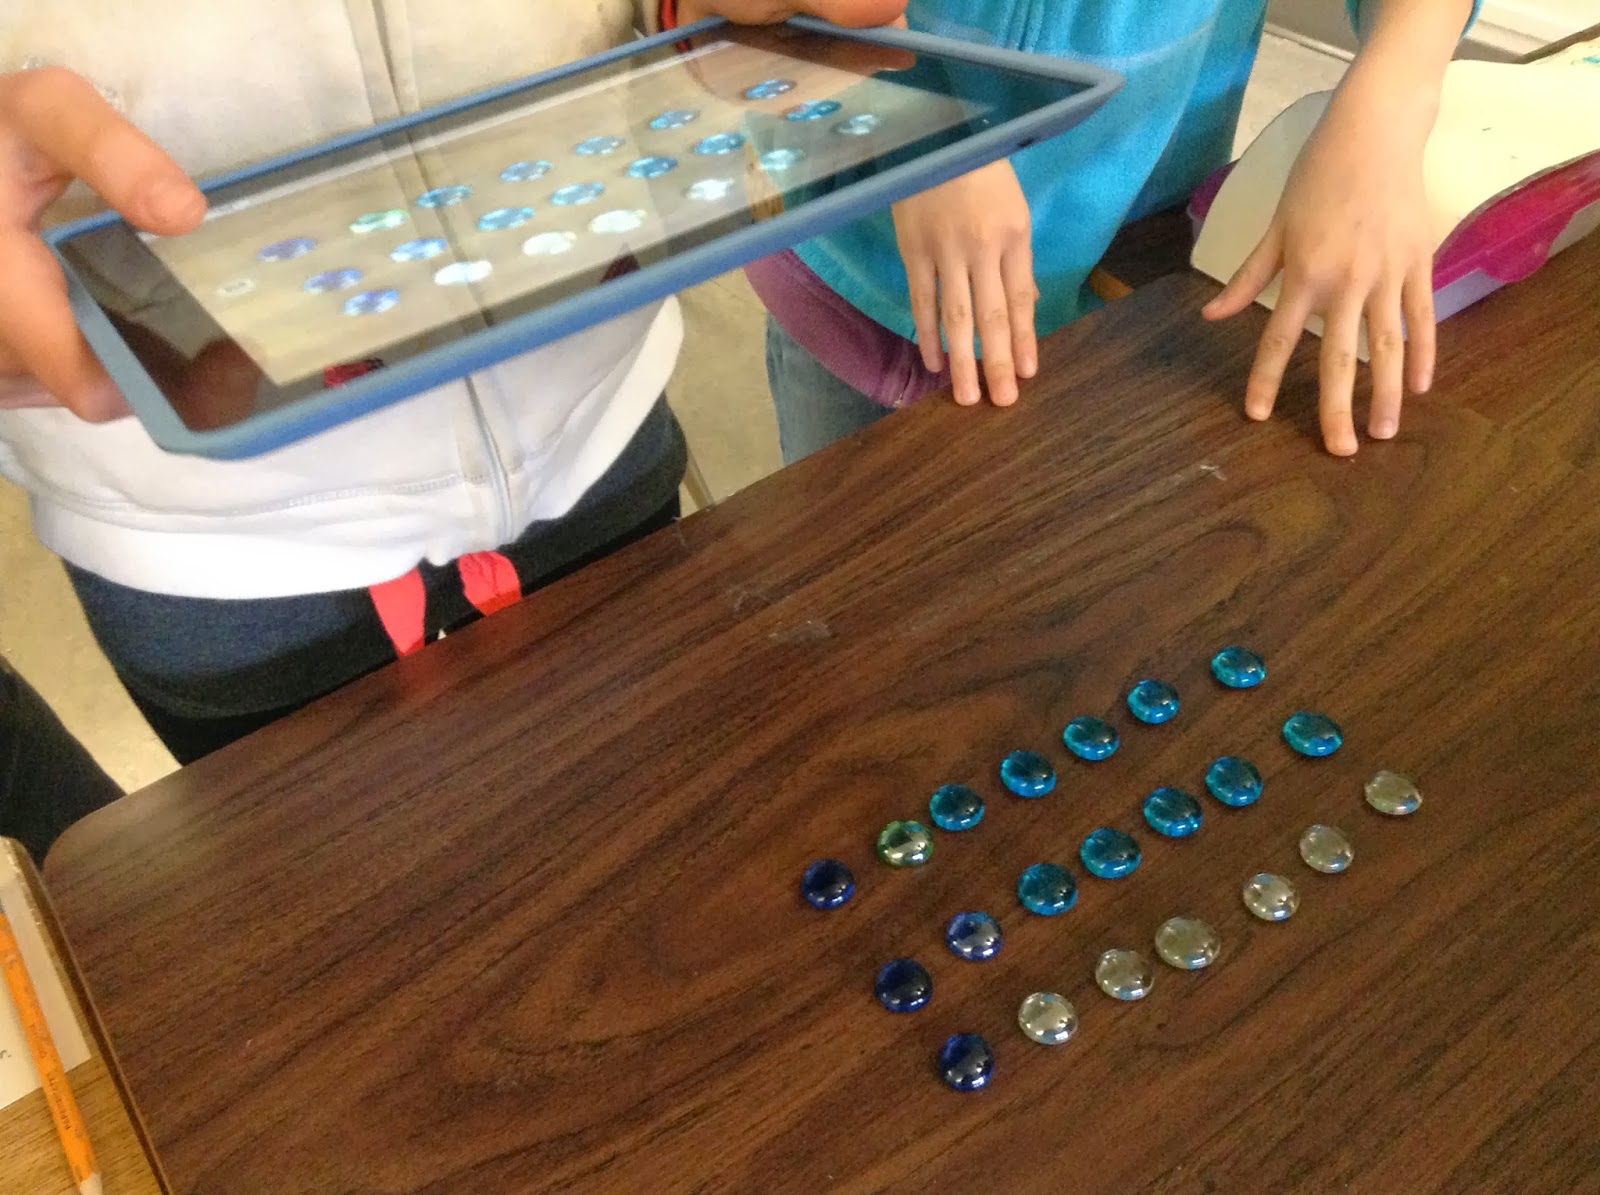
The main focus of the evening was the students' inquiry projects. There was such a range of project types - models, experiments, investigations and dramatic representations of science concepts. It was great to see so many projects en franca is as well! For some classes, the teachers provided an overall topic such as Simple and Compound Machines or Electricity of the Life Cycle of the Salmon to guide students' projects.  Some teachers provided a list of suggestions for students to choose from while some students told me they found their projects on YouTube and then replicated them. In other classes, students came up with their own personal inquiries and had an opportunity to pursue areas of interest and design their own investigations - such as making the best chocolate chip cookie, investigating what colour of cupcake icing is most appealing, what makes mood rings work or investigating what makes air hockey pucks glide on air like they do.


 CTV was also on site and some projects were selected to be highlighted on the 6:00 news! CTV Meteorologist Michael Kuss interviewed the students while they explained their projects. Speaking to  Michael afterwards, he said he had a great time at the event and was so happy to see kids being so excited about science.
 A scientists from Science World did a Science Surprises Show to close the evening, sending rubber chicken projectiles into the audience, testing our rods and cones by looking at a Canadian flag and playing with our senses with wacky flavoured jelly beans.

Here is a short slide show with some highlights from Science Jam 2014:


A parent commented to me that planning an event like this must be kind of like planning a wedding, months and weeks of preparation goes into it, and the details...oh the details! And then, boom, in 3 hours, it's all over. Science Jam has a long strong history in our district but I am beginning to think of ways to extend and enhance the enthusiasm for science that it nurtures and celebrates.

An event of this magnitude is not possible without a village behind it.

Thank you to our corporate sponsors HSBC and the Co-operators, the Richmond Review, Aberdeen Centre, CTV and Science World at Telus World of Science. 

Thank you to J & T Sports for the printing and sorting of the students' t-shirts and to Uno Digital for the display signage.

Thank you to Scholastic, Nelson Education and Spectrum Education for providing gifts to the teachers and to Science World for providing youth passes to the students.

Thank you to Marie Thom (Early Learning Teacher Consultant) for her tremendous support yesterday and to Rosalind Poon (Teacher Consultant on maternity leave and former Science Jam Coordinator) for her advice along the way).

Special thanks to Maureen LaBelle (Learning Services Secretary), Kevin Lyseng (Teacher Consultant), David Sadler (Communications and Marketing Manager) and Andrea Davidson (District Administrator) for their support and for being a part of this year's Science Jam team.

~Janice

Saturday, February 15, 2014

assessing mathematical communication

I made my monthly visit to Quilchena Elementary on Wednesday and the intermediate teachers and I worked together around assessing communicating about mathematics.

In Una Simpson's grades 4 and 5 class, the grade five students had been learning about quadrilaterals and their attributes while the grade 4s continued to develop their understanding of prisms. As a performance assessment task, Una designed a task where the grade four students would create a quadrilateral on a geoboard (real or virtual - on the Geoboard iPad app) and then the grade five students would ask their partners questions about the attributes of the quadrilateral that could be answered yes or no.


Una recorded some language prompts on the whiteboard such as angles, parallel, perpendicular, congruent, etc to support students' questioning. The students took a photo of their quadrilateral with the iPad and then inserted it into the ShowMe app and then recorded their question and answer session, with the grade five student trying to determine the size and shape of the quadrilateral.


What we quickly noticed is that although the grade 4 students could all create quadrilaterals, they didn't actually have the language for and understand the questions their classmates were asking them about the attributes. I listened with interest as a grade 4 student confidently say "yes" that there were parallel sides in her shape when there clearly was not. I pointed this out to the students and of course the grade 5 student was frustrated because it had thrown him off in trying to figure out the shape.

Una and I agreed that the task itself was excellent for assessing students' use of mathematical vocabulary and to assess understanding of attributes of shapes, but that students needed to be paired with students who had the same instruction and background knowledge for the task to be successful. So when teaching a combined class, if you do not expose all students to both sets of learning outcomes, you would need to separate this task by grade levels. The grade 4s could have easily have done a similar task but using prisms (using three dimensional blocks in the classroom) instead of the quadrilaterals.

*****

In Andrew Livingstone's grade 7 class, the students are accustomed to using self-assessments in other curricular areas, using a four point scale in line with our BC Performance Standards language. The intermediate teachers worked together to create a self-assessment scale to use with math journals, specifically focusing on communicating mathematical thinking. When we discussed it, we realized it could also be used with screencasting that the students have been doing with the iPads.

The students had already completed individual ShowMes using a practice question from the Grade 7 Numeracy FSA. A few students volunteered to share their ShowMes up on the big screen in front of the class so that we could use the self-assessment tool with them. I spent some time going through each level of criteria and what that might look and sound like in a ShowMe. We then shared the first ShowMe, with the students having the assessment tool in front of them. It was interesting to note that none of the students recorded anything on the assessment tool until after the ShowMe was over. I shared how I took notes during the ShowMe, so that I had "evidence" for my assessment for each level of criteria. The students soon realized that this would have been helpful. We discussed how they "scored" the ShowMe and asked for specific examples of why they chose "fully" or whatever level they chose.


For the second ShowMe we watched, the students took notes as they watched and had a better sense of what kinds of things they should be watching and listening for. They agreed the second time was easier than the first and that it would get easier the more they did it.

Here's a short little video from our session together:

With both examples, we had long discussions about the difference between "Show your work" and "Explain your thinking" building on previous discussion we have had with this class about descriptive vs explanatory thinking. For these tasks, the show your work was really about showing what you did to complete the task/how you did the calculations whereas the explain your thinking was the metacognitive part, the explaining the "why" you chose to solve it the way you did and your reasoning involved in completing the task. We are finding that we are really needed to pull this out of students, that they just do the reasoning part but aren't used to articulating it. We are going to make a few revisions to the assessment tool to help students understand these differences more clearly.

 ~Janice

Sunday, February 9, 2014

Primary Scientists: looking closely at our practice

A large group of primary teachers in our district are taking part in the third year of Primary Scientists, a professional learning series focusing on process-based science and initially created as an implementation series to support the development of the Coast Metro Science Performance Standards. Teachers are all engaging in looking closely at one aspect of their practice in terms of science teaching and learning with an overall group focus of thinking about how we assess process and inquiry-based science experiences.

Using the science performance standards and assessment tools from the current K-7 Science IRP and the teacher resource book we are using for this series, teachers are asked to try different ways of assessing science performance tasks.

Teachers have chosen different aspects of science to focus on this year as part of their own inquiries into their professional practice: taking learning outdoors, looking closely (a national collaborative project), the processes of science, observational drawing and place-based learning using indigenous knowledge.

Based on the Looking Closely books by Frank Serafini, several of the teachers created their own versions of the books with their students. With her grade one class at Garden City, Jenna Loewen created a class book using garden photographs and having the students brainstorm what they could be.

April Chan at Blair took her students outside to look closely and create a peekaboo page with a hole cut out on the front page to take a peek at the illustration the students did of something they observed.


Sharon Baldrey and Kathleen Ellis from Lee Elementary looked closely at ice with their kindergarten classes. After freezing blue-dyed water into globes of ice, the students used salt and flashlights to investigate the properties of ice and how it melts. The teachers commented on how engaged the students were and what great inquiry questions came up during their investigations. Amazing photos of an amazing experience!


Louesa Byrne's K/1 class at Thompson looked closely at leaves in the fall and inspired by Ann Pelo's book, The Language of Art, observed and represented the leaves in using multiple forms of art materials - liquid watercolours, crayon rubbings, technical drawings with fine line markers and creating leaf forms with wire.


April Chan at Blair did a similar focused study of leaves with a small group of primary students. The students used the PicCollage app on the iPads to document the different ways they created representations of their leaves.
So as we engage our students in looking closely at the world around them, we too are looking closely at student learning in science.
-Janice

Wednesday, February 5, 2014

using mathematical language at Garden City

I am spending some time with a small group of teachers at Garden City this term, extending the work they are doing around their school goal of math to a collaborative inquiry project. The teachers are looking at ways that math journals might help students to represent their mathematical thinking. After a lunch hour meeting during which discussed different ways students could add to their recordings in their journals by using photographs, speech and thought bubbles and diagrams created on the iPad, I was able to spend time in two of the classrooms last week.

In Jenna Loewen's grade one class, the students have been investigating measurement and building understanding of comparison, using specific math language to explain their comparisons. Jenna created an anchor chart to support her students.

The students were excited to use the iPads for a measurement task. They worked in small groups and were asked to choose an item in the classroom and then find two other items and compare their measurements. They learned how to use the camera on the school's iPads and then used the app, PicCollage to fit their photographs into a template and add text. Although most students focused on shorter than and longer than, some students explored taller than as well as heavier and lighter than.


The grade one students particularly enjoyed seeing their PicCollages posted up on the big screen, by connecting the iPads to the projector.


In Paula Zack's grades 5 and 6 class, the students have been learning about the relationship between multiplication and division using arrays as a model. The students worked in groups and used materials to create arrays and then used a screencasting app called Doceri to explain their understanding.


The following is a Doceri movie created by a small group of students. As the teacher and I discussed, these screencasts are a great "assessment for learning" tool, as misconceptions are captured. For example, in this little movie, the students do a great job of listing the multiplication and division facts represented by the array and acknowledge that if the array was rotated, their equations wouldn't change. The students (in odd chipmunk voices...) explain that 4x5 is the same as 5x4 by saying the order doesn't matter and then generalize this to division, where the order actually does matter (20 divided by 4 and 4 divided by 20 are not the same thing). The other generalization the students make is that for both multiplication and division, equal groups are used. This is the case when we use arrays as a model, but when we divide in real life, there are often those dreaded remainders! Again, something to take into consideration when planning the next set of learning experiences for these students.


Lots to learn from listening to students explain their mathematical thinking!
~Janice

Saturday, February 1, 2014

descriptive vs explanatory thinking in mathematics

On Wednesday morning, I made my monthly visit to Quilchena to take part in a collaborative inquiry with the intermediate teachers looking at alternative ways to assess students' mathematical thinking.

In Una Simpson's grades 4 and 5 class, the students had been studying various aspects of geometry. The day before I visited, Una listed a series of geometry-related topics on the board and pairs of students were assigned a topic to highlight in a "ShowMe" screencast. Students were asked to both describe the shapes they were using by their attributes and to explain the concepts involved such as what makes a prism a prism, what is a polygon, what is the relationship between two and three-dimensional shapes?

The students took several photographs that could be used to explain their topic.


And then used the ShowMe screencasting app to record their descriptions and explanations.


In Tanya Blumel's grades 5 and 6 class, we looked at the two types of division (sharing/partitive and grouping) and then the students worked through some three digit divided by one digit questions using the grouping method. As students shared their work, we focused on how they explained their thinking and the mathematical language they used to support their reasoning.

In Andrew Livingston's grade 7 class, the student have been learning about the relationship between fractions, decimal numbers and percentages. He gave the students a task from their textbook but instead of writing their responses in their math journals, the students were asked to explain their reasoning orally using the ShowMe app. The students coloured in the various shapes on the grid and then had to determine the fraction, decimal equivalent and percentage of the total grid for each space. The students' reasoning for the triangular shapes was the most interesting to listen to.


 This is ongoing work and we hope to see the benefits of focusing on oral explanations when we ask students to write about their thinking...hoping that the metacognitive writing will be easier for them with these background experiences.
~Janice