Showing posts with label technology. Show all posts

Monday, March 10, 2014

what we know about coins

The Grade 1 students in Jenna Loewen's class at Garden City Elementary have been happily singing away to the classic song "Canada in my Pocket" by Michael Mitchell as they have been learning about the Canadian coins.

When I visited their class on Thursday, they could tell me all about the values of the coins, what colours they were and what animals or boats were on them. One student was also happy to share all that he had learned about the caribou...


We had small collections of pennies, nickels, dimes and quarters. The students enjoyed examining each coin and feeling the difference in their textures. They looked closely at the numbers, words and pictures on the coins. Each team of students took turns taking photographs of the coins using the iPads.


We then used the app Haiku Deck (like powerpoint for the iPad) and the students created captions describing each coin.

Here is an example of a group project created in Haiku Deck:


Created with Haiku Deck, the free presentation app

Our redesigned curriculum in mathematics has re-introduced aspects of financial literacy beginning at the grade one level. Learning to identify and describe Canadian coins will be one of the curricular content pieces at the grade one level and this is an example of a task that will support student learning in this area.
~Janice

showing what we know in math...first time using iPads

On Thursday, I introduced iPads in the classroom to Tina Grigoriadis' grades 3 & 4 students.  Garden City has 8 iPads (with more on the way) and the students were very excited to use them for math. They worked so well in groups of three, collaborating and sharing.

The class has been learning about multiplication and has just begun to learn about division and its connection to multiplication, specifically looking at arrays. Tina had many visual supports up in the classroom to support students with their mathematical understanding.


We introduced the students to the MathTappers iPhone app called Multiples. It has options for working with different levels of factors and practicing both multiplication and division, with ten frames and hundred charts as visual supports.


 The students then worked together, creating three different arrays using math materials. They learned how to take photographs with the iPads and then import these photographs into an app.


We then taught the students how to use the doceri app to use photographs, diagrams and the students' voices to represent and share their understanding of multiplication and division through the use of arrays.


 Some students preferred preparing a script that they could read as they recorded their voices on the iPad.

Here are some examples of the students' screencasts:


These screencasts reveal a "first-timers" use of the app - figuring it out, seeing what it can do. Most of the students described multiplication and division equations for the array they had photographed. A further extension (maybe for second-timers) would be to further explain their thinking about the connection between multiplication and division and how an array supports their understanding.

When we asked the students what they liked about using the iPads, one student commented that he was having fun but then he realized he was learning at the same time. As educators, we know that engagement leads to higher rates of learning and retention of information and these kinds of experiences that are hands-on, minds-on and collaborative are highly engaging for students.
~Janice


Saturday, March 8, 2014

water cycle simulation in grades 2&3

The McNeely grades 2 & 3 teachers continue to explore ways of using iPad technology to capture students' learning in science. On Monday in Anna Nachbar's class, we discussed the water cycle - precipitation, collection, evaporation, condensation. We had lots of recent examples of precipitation to refer to - rain, sleet and snow.

We simulated the water cycle using the classic boiling kettle and cold cookie sheet demonstration. We poured the water into the kettle (collection), turned the kettle on and boiled the water, watching the steam come out (evaporation) and then watched as water droplets formed on the bottom of the cold cookie sheets (condensation) to the point that the poured down the cookie sheet and onto the desktop (precipitation).

The students worked in pairs and took photographs of each stage of the demonstration. Some students also took photographs outside as it was a very rainy day and there were good examples of collection (puddles), precipitation (rain) and condensation (clouds).
 The grades 2 and 3 students then were introduced to the app PicCollage and the students included four photographs, one for each stage of the water cycle. They added text to label or explain the stages.

With PicCollage it is easy for students to email their project as a jpg file and the following are some examples of the students' work:


Two students did some "app smashing" and used the image they had created in the PicCollage app and used it in the ShowMe app to further explain the stages of the water cycle:


 In Deanna Mayotte's class, we did the same simulation but this time, the students used the screencasting app ShowMe to document and explain the four stages of the water cycle.


And I liked how these two students connected each stage of the water cycle to what was happening in the real world outside!


During this professional inquiry, the teachers and I have talked a lot about the value of having the students develop a repertoire of apps that they can use to represent and share their science learning. After spring break, we intend to introduce another app or two and then maybe decide on a science task we can do and have the students choose the app they would like to use to share their learning.
~Janice

Saturday, March 1, 2014

creating double bar graphs to compare winter olympics medal counts

The grades 5 and 6 class at Garden City has been learning about bar graphs. As part of a collaborative inquiry amongst a small group of teachers at the school, we have been looking at how iPad technology can enhance mathematical communication and engagement.

This week we provided the students with the medal counts charts from the 2010 and 2014 Winter Olympics. The students were welcome to use another data set or quickly create their own survey to collect some data, but the focus was on the creation of graphs using the iPads so I think all of the students just used the medal counts for their data set.

The students used the screencasting app doceri to create the graphs, after a short discussion about when and why you would use a double bar graphs. We reviewed the parts of a graph and then students worked in small groups to create their graphs. There was some frustration in labelling the axes and the students wished there was a typing/text feature that was easy to use.


The students' explanations in the following screencasts reveal a few things - misuse of mathematical vocabulary in labelling axes, understanding of the components of a graph to convey information clearly and a hint at the purpose of bar graphs. We didn't provide specific criteria about what the screencasts needed to have and if we had, we might have received more consistent information included in all the screencasts. The students seemed to have a good sense about what information they should try and convey though, without our explicit guidance.


And yes, the students could have just as easily created these graphs using paper and written out their analyses instead of using a screencasting app. After introducing apps like doceri, they become part of a student's repertoire and hopefully, they will be given choices in how they might represent and share their learning, and those who want to use paper and pencil can and those who want to use a screencasting app can do so or there might also be an option 3!

When we are assessing mathematical understanding, does it matter how students show us what they know? I don't think so. I think our role as teachers is to make sure students have many opportunities to show what they know about something, in ways that work for them. We want all our students to be successful and screencasting apps like doceri allow students who may have difficulties writing their thinking down on paper a way to show what they know, using visual supports and diagrams to enhance their explanations.
~Janice

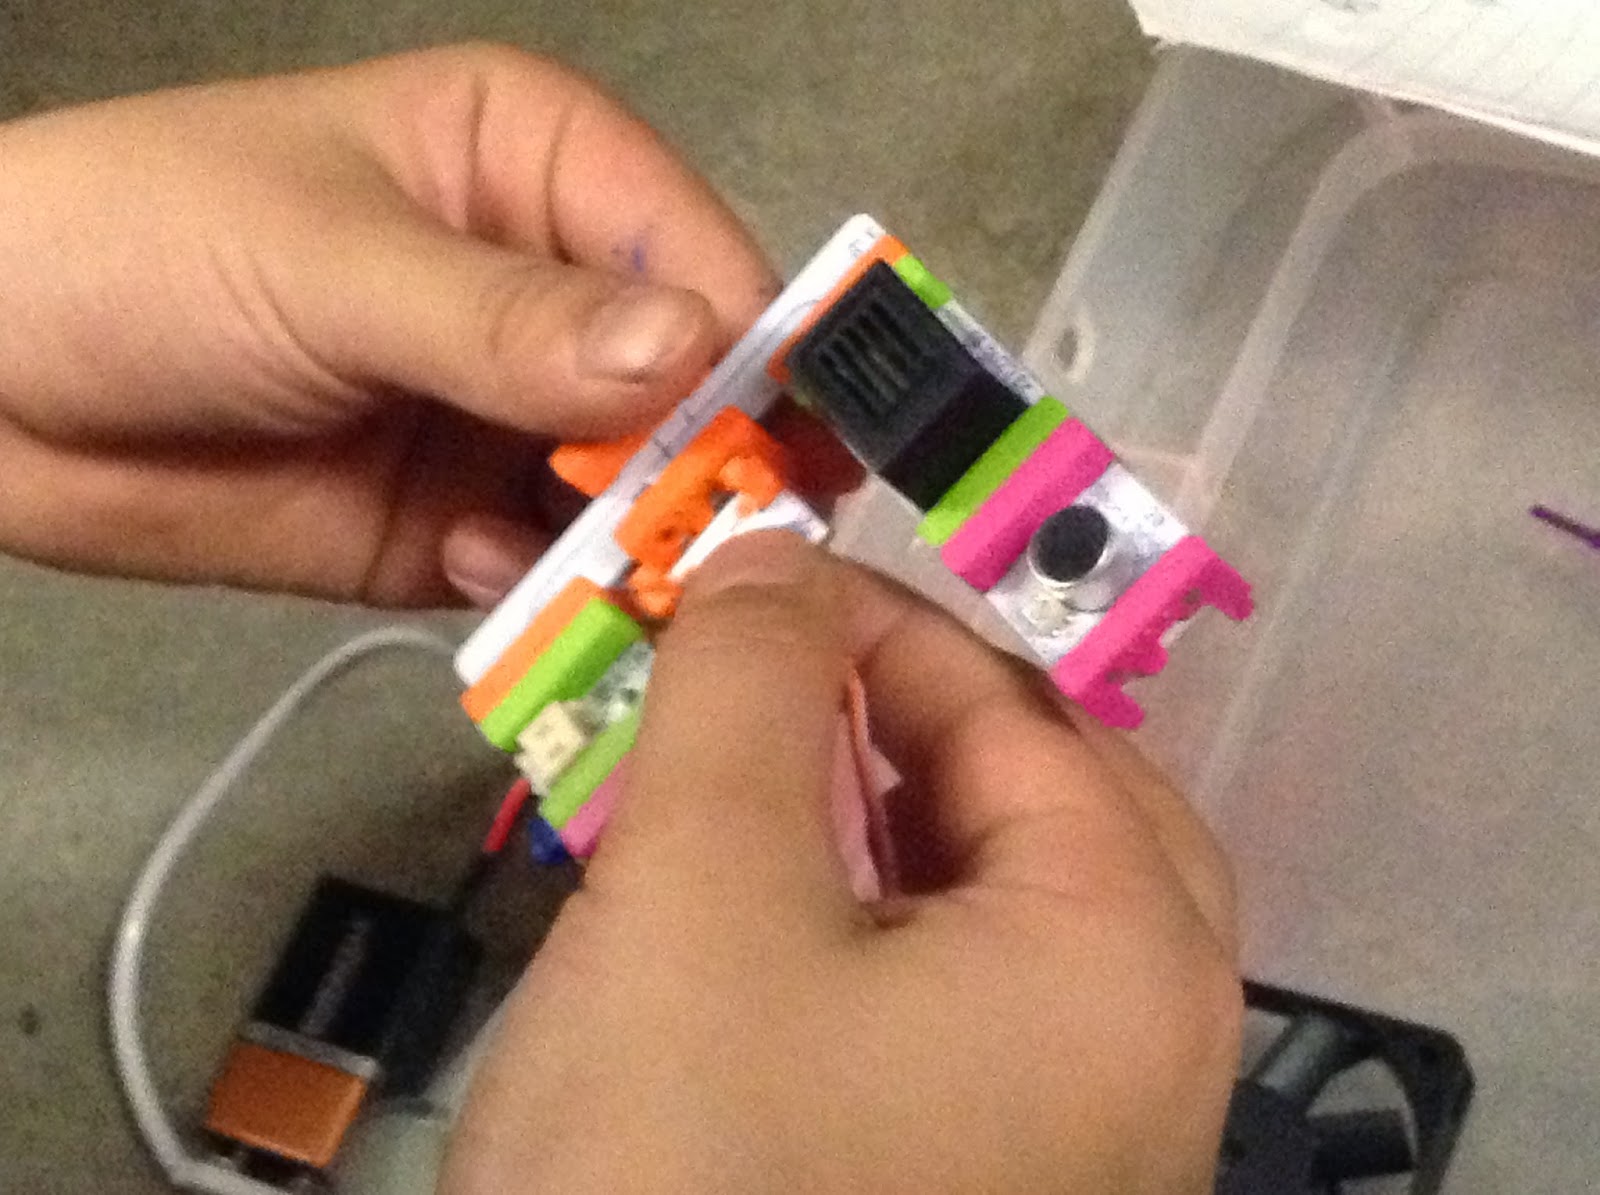
creating littleBits circuits

I spent some time on Friday in the grades 5 & 6 class at Garden City. This term, the students have been studying electricity as their science topic and their teacher Paula Zack (who is in for Liz Nasu who is on mat leave) thought it would be interesting to see what connections they made to what they learned about electricity as they investigated littleBits.


The students also discovered that the order of the littleBits did matter. At first they weren't sure and this group was convinced that there button wasn't working, until they changed the order of the littleBits. They explained that the information that needs to make something happen needs to come first (the button before the buzzer).
"The button doesn't work if it comes after the buster, it has to come before the buzzer. Electricity doesn't flow backwards."


As students investigated and tested things out with the littleBits, I recorded several of the observations and comments the students made, revealing their developing understanding of electricity:
-there are metal prongs so when you snap littlebits together it completes the circuit
-the electrons flow from the battery
-the green ones all do something
-the power switch controls the flow of electrons 
-we found out the slide dimmer changes the sound of the buzzer
-the magnets only go in a certain way otherwise they won't connect
-I close the circuit when I turn off the power switch

Some of the groups were very interested in the three-pronged fork bit and played around with changing the variables and bits attached to see how these changes affected different bits. They noticed that some bits were louder, brighter or moved more quickly when less bits were attached to the fork.
"Because they need more energy."
"Servo goes faster when you take other bits off."

And after some experimentation, some students were still confounded by the purpose of the orange wires:
"I still don't know what this does!"

and then they realized they could use them to reach further with their circuit when they create things.

The circuits got more and more complicated as the session moved on...

One session with the littleBits was not enough and I could tell that the students's synapses were firing in their brains with ideas of what they could create. Hopefully, the class will be able to book the district kit some time during third term.

Here's a short Animoto video overview of this class' first littleBits session:


I'm sure the students have lots of ideas for what they might create with the littleBits now that they know what they can do!
~Janice

Saturday, February 15, 2014

assessing mathematical communication

I made my monthly visit to Quilchena Elementary on Wednesday and the intermediate teachers and I worked together around assessing communicating about mathematics.

In Una Simpson's grades 4 and 5 class, the grade five students had been learning about quadrilaterals and their attributes while the grade 4s continued to develop their understanding of prisms. As a performance assessment task, Una designed a task where the grade four students would create a quadrilateral on a geoboard (real or virtual - on the Geoboard iPad app) and then the grade five students would ask their partners questions about the attributes of the quadrilateral that could be answered yes or no.


Una recorded some language prompts on the whiteboard such as angles, parallel, perpendicular, congruent, etc to support students' questioning. The students took a photo of their quadrilateral with the iPad and then inserted it into the ShowMe app and then recorded their question and answer session, with the grade five student trying to determine the size and shape of the quadrilateral.


What we quickly noticed is that although the grade 4 students could all create quadrilaterals, they didn't actually have the language for and understand the questions their classmates were asking them about the attributes. I listened with interest as a grade 4 student confidently say "yes" that there were parallel sides in her shape when there clearly was not. I pointed this out to the students and of course the grade 5 student was frustrated because it had thrown him off in trying to figure out the shape.

Una and I agreed that the task itself was excellent for assessing students' use of mathematical vocabulary and to assess understanding of attributes of shapes, but that students needed to be paired with students who had the same instruction and background knowledge for the task to be successful. So when teaching a combined class, if you do not expose all students to both sets of learning outcomes, you would need to separate this task by grade levels. The grade 4s could have easily have done a similar task but using prisms (using three dimensional blocks in the classroom) instead of the quadrilaterals.

*****

In Andrew Livingstone's grade 7 class, the students are accustomed to using self-assessments in other curricular areas, using a four point scale in line with our BC Performance Standards language. The intermediate teachers worked together to create a self-assessment scale to use with math journals, specifically focusing on communicating mathematical thinking. When we discussed it, we realized it could also be used with screencasting that the students have been doing with the iPads.

The students had already completed individual ShowMes using a practice question from the Grade 7 Numeracy FSA. A few students volunteered to share their ShowMes up on the big screen in front of the class so that we could use the self-assessment tool with them. I spent some time going through each level of criteria and what that might look and sound like in a ShowMe. We then shared the first ShowMe, with the students having the assessment tool in front of them. It was interesting to note that none of the students recorded anything on the assessment tool until after the ShowMe was over. I shared how I took notes during the ShowMe, so that I had "evidence" for my assessment for each level of criteria. The students soon realized that this would have been helpful. We discussed how they "scored" the ShowMe and asked for specific examples of why they chose "fully" or whatever level they chose.


For the second ShowMe we watched, the students took notes as they watched and had a better sense of what kinds of things they should be watching and listening for. They agreed the second time was easier than the first and that it would get easier the more they did it.

Here's a short little video from our session together:

With both examples, we had long discussions about the difference between "Show your work" and "Explain your thinking" building on previous discussion we have had with this class about descriptive vs explanatory thinking. For these tasks, the show your work was really about showing what you did to complete the task/how you did the calculations whereas the explain your thinking was the metacognitive part, the explaining the "why" you chose to solve it the way you did and your reasoning involved in completing the task. We are finding that we are really needed to pull this out of students, that they just do the reasoning part but aren't used to articulating it. We are going to make a few revisions to the assessment tool to help students understand these differences more clearly.

 ~Janice

Sunday, February 9, 2014

Primary Scientists: looking closely at our practice

A large group of primary teachers in our district are taking part in the third year of Primary Scientists, a professional learning series focusing on process-based science and initially created as an implementation series to support the development of the Coast Metro Science Performance Standards. Teachers are all engaging in looking closely at one aspect of their practice in terms of science teaching and learning with an overall group focus of thinking about how we assess process and inquiry-based science experiences.

Using the science performance standards and assessment tools from the current K-7 Science IRP and the teacher resource book we are using for this series, teachers are asked to try different ways of assessing science performance tasks.

Teachers have chosen different aspects of science to focus on this year as part of their own inquiries into their professional practice: taking learning outdoors, looking closely (a national collaborative project), the processes of science, observational drawing and place-based learning using indigenous knowledge.

Based on the Looking Closely books by Frank Serafini, several of the teachers created their own versions of the books with their students. With her grade one class at Garden City, Jenna Loewen created a class book using garden photographs and having the students brainstorm what they could be.

April Chan at Blair took her students outside to look closely and create a peekaboo page with a hole cut out on the front page to take a peek at the illustration the students did of something they observed.


Sharon Baldrey and Kathleen Ellis from Lee Elementary looked closely at ice with their kindergarten classes. After freezing blue-dyed water into globes of ice, the students used salt and flashlights to investigate the properties of ice and how it melts. The teachers commented on how engaged the students were and what great inquiry questions came up during their investigations. Amazing photos of an amazing experience!


Louesa Byrne's K/1 class at Thompson looked closely at leaves in the fall and inspired by Ann Pelo's book, The Language of Art, observed and represented the leaves in using multiple forms of art materials - liquid watercolours, crayon rubbings, technical drawings with fine line markers and creating leaf forms with wire.


April Chan at Blair did a similar focused study of leaves with a small group of primary students. The students used the PicCollage app on the iPads to document the different ways they created representations of their leaves.
So as we engage our students in looking closely at the world around them, we too are looking closely at student learning in science.
-Janice